From raw event data to validated ReliaSim parameters
Design and understand distributions for free. Fit raw historian data with ReliaStats. View and compare the results — also free.
Seven tools — one workflow
Explore, design, view, compare, and validate interrupt distributions in the browser — plus automated distribution fitting in the ReliaStats desktop app. Explorer, Quick Start & Designer free, forever. Viewer, Comparison, Validation, and desktop Fitting require a ReliaStats subscription.
Interrupt Quick Start
The guided way in. Pick an equipment failure pattern and ReliaStats sets a sensible TTF + TTR pair for you — no distribution theory required.
- Plain-language failure-pattern presets
- Instant availability % and a stops-per-shift readout
- One click into the full Designer to fine-tune
Interrupt Designer
Build a TTF + TTR pair from scratch. Explore what distribution choices mean in practice before committing to a fit.
- Working / Failed state timeline over a configurable shift window
- Box-and-whisker: p5, Q1, Median, Q3, p95
- Switch timeline scenario: Mean, Median, Q1, Q3, or p95
- PDF, CDF, and Survival curves for TTF and TTR
- Availability % from Mean TTF and Mean TTR
Interrupt Explorer
Compare reliability across every failure cause at once. Pareto-rank the worst stations and overlay their R(t) survival curves — straight from your Excel or CSV stop logs.
- Reads .xlsx / .csv stop & interrupt logs
- Multi-cause Pareto + chronic-stop rate
- Overlaid reliability R(t) survival curves
- Runs locally — your data never leaves your machine
Interrupt Fitting · desktop app
In the ReliaStats desktop app, upload raw historian event logs. ReliaStats automatically identifies failure and repair patterns, fits the best distribution for each interrupt, and exports a ReliaSim-ready file.
- Import raw failure & repair event logs
- Automatic cause group identification
- Goodness-of-fit tests (K-S, Anderson-Darling)
- Distribution ranking and model selection
- Export fitted interrupt file for ReliaSim
Interrupt Viewer
Load any ReliaSim interrupt file and browse every interrupt. Click a row to inspect its uptime and downtime distributions — fast audit of a full model's parameterization.
- All 8 ReliaSim distribution types supported
- Box-and-whisker percentile strip per distribution
- PDF, CDF, and Survival function views
Interrupt Comparison
Two interrupt files side by side. Differences color-coded by severity; curves overlaid for direct inspection.
- Color-coded rows by % change
- Overlaid PDF / CDF / Survival curves
- Every numeric difference surfaced automatically
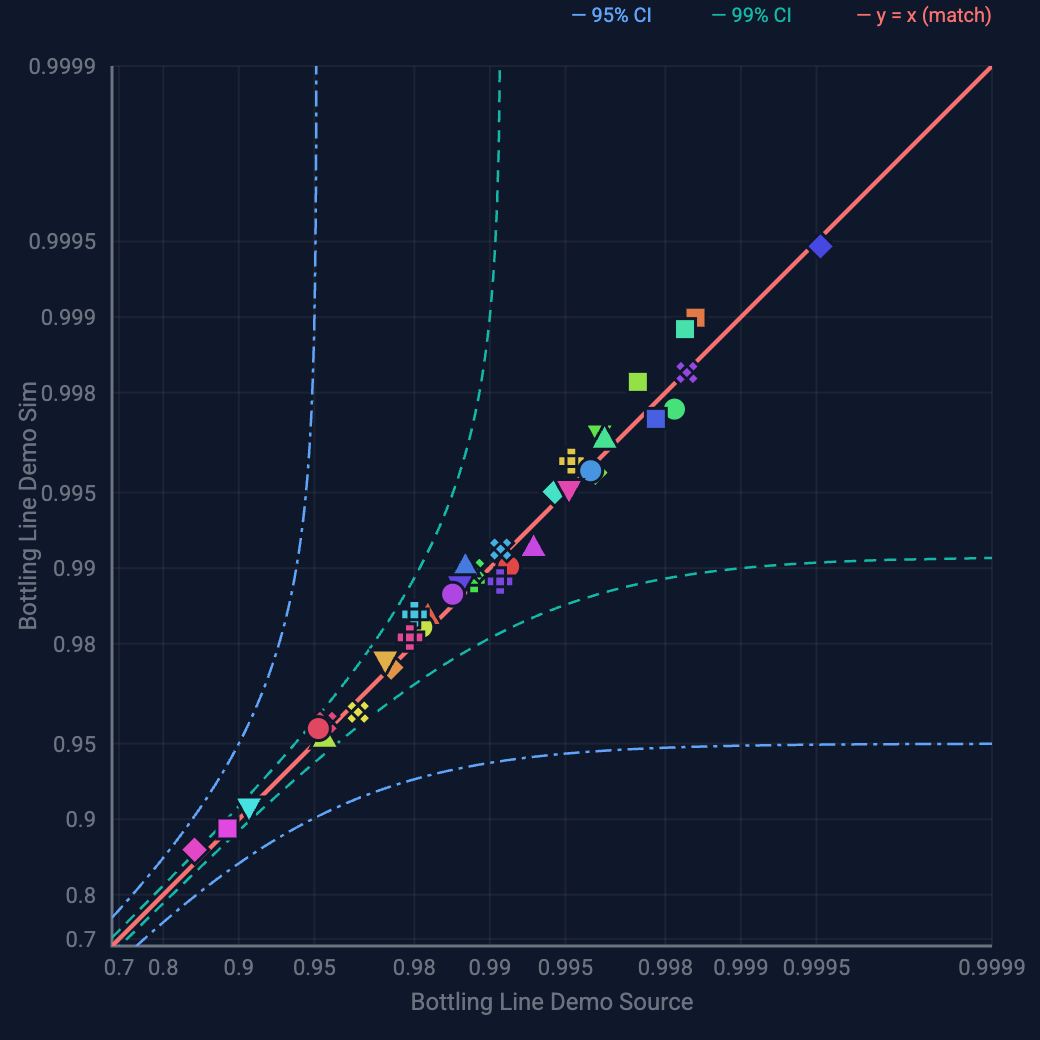
Interrupt Validation
Validate against history — within 1%. Each point is an interrupt; on the diagonal = the sim matches the historian. ReliaSim's output cycles back here for comparison — refine and re-run until every interrupt lands on the line.
- Source vs. sim availability, interrupt by interrupt
- 95% PI / 99% CI bands flag outliers instantly
- Closes the fit → simulate → validate loop